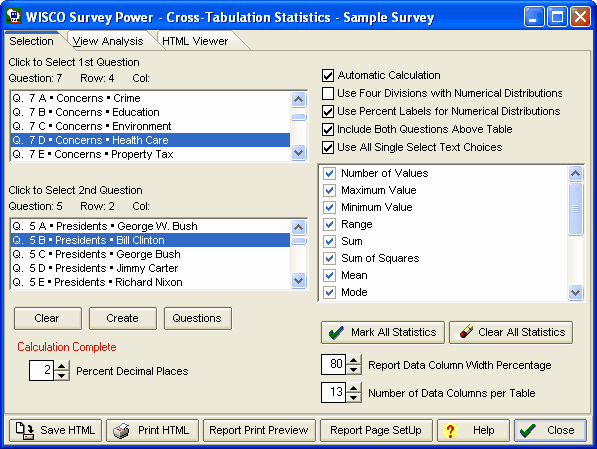
Cross-Tabulation Statistics
 If the Automatic Calculation check box is marked, and the question types are valid, the calculation can be performed before this window is displayed.
Use Four Divisions with Numeric Distributions
If the Automatic Calculation check box is marked, and the question types are valid, the calculation can be performed before this window is displayed.
Use Four Divisions with Numeric DistributionsWhen numerical entry questions are added to the database, there is a natural distribution of these numbers from a minimum value to a maximum value. This range of values can be separated into 4 or 10 groups to find relations with the other survey question being analyzed. If 10 groups are used, this range is divided into 10 percentile groups Use Percent Labels for Numeric Distributions
If checked, the four divisions will be labeled 0 - 25%, 26 - 50%, 51 - 75%, and 76 -100%. If unchecked, the program will find the actual minimum and maximum values, and display the actual values for the minimum, 1st quartile, mean, 3rd quartile, and maximum values. Statistical values in each row match the criteria displayed in the first column. Up to 15 Statistical values can be displayed in the reports. Mark individual check boxes to include that statistical function. Click the "Mark All Statistics" button to quickly check all the statistical functions. Number of Values
This count does not include any empty values from the series of numbers being analyzed. Maximum Value
This function finds the largest value in the series of numbers being analyzed. Minimum Value
This function finds the smallest value in the series of numbers being analyzed. Range
The range is found by subtracting the minimum value from the maximum value. Sum
This function adds the values of the series of numbers. Sum of Squares
This function calculates the deviations of the series values from the mean, squares those deviations, then adds those numbers to get a final result. Mean
This is commonly called the average. It is calculated by adding the series values, and divided by the number of values. Mode
This is the most common value in the series of numbers. If all values in the series are unique, no modal value is displayed. Median
This function displays the middle value from the sorted set of values. Half of the values fall below, and half the values are above the median. Standard Deviation
The standard deviation is used to measure how values are distributed around the mean. Skew
The skew measures the symmetry of the distribution of values. If the distribution of numbers includes a greater number of larger values, it has a positive skew. If the distribution includes more lower values, it has a negative skew. First Quartile
This value marks the 25th percentile. Third Quartile
This value marks the 75th percentile. Null Values
This is a count of empty values from the series of values being analyzed.