Survey Charts - Modified Defaults
 Use Modified Default Chart Settings
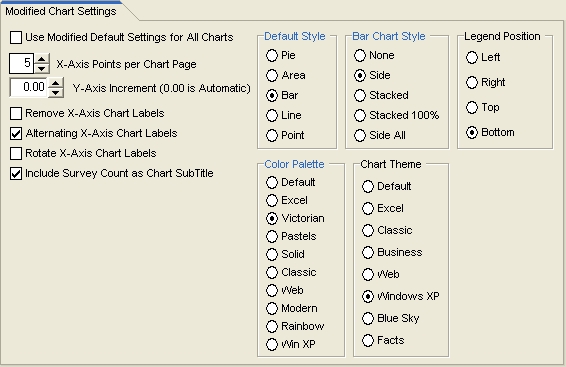
If a custom chart file is available in the data folder, those file settings will be used for the chart. If the custom chart file is not in the data folder, then this checkbox will determine the base chart. If unchecked, the program defaults will be used. All settings on this screen will be ignored. If this check box is checked, the chart settings on this screen are used. X-Axis Points per Chart Page
If your chart contains more data than can be legibly displayed on one chart screen, you may wish to divide the chart into pages that can be leafed through. All charts can be divided into a set number of points per page. This allows the chart to be viewed with multiple pages. If the number of points per page is set to 0 on the default settings screen, all data points will be charted on a single page chart. Y-Axis Increment
If the increment is set to zero, the program will determine the chart increment. Remove X-Axis Chart Labels
Long text labels may cause problems. This option removes the labels. The labels are still present in the legend. It is recommended that Multiple colors be used for a single series chart to enhance the display. Alternating X-Axis Chart Labels
Long text labels may be overlapped. Alternating labels are placed higher and lower to prevent the overlap. Rotate X-Axis Chart Labels
Long text labels may be overlapped. This setting allows the labels to be rotated 90 degrees. Include Survey Count as Subtitle
The second line of the chart label will display the survey count if this is checked. This setting is also used for reports. Default Chart Style
The selected chart type will be used by the data. A pie chart can only be used with a single data series. The cross-tabulation charts always use a bar series. Bar Chart Style
If the bar series is used for a chart, the bars representing the data can be either grouped, stacked, or stacked 100%. Legend Position
The chart legend can be positioned to the left, right, top or bottom of the chart. Color Palette
Each palette represents a different combination of colors that can be used by the series data. Chart Theme
Chart themes enable you to quickly change many chart properties with a single mouse click. Several themes are provided through the Themes Editor.