Survey Chart Editor
 The top panel includes two buttons and a display of multi-page chart information.
Default Settings
The top panel includes two buttons and a display of multi-page chart information.
Default SettingsThe first button displays a new screen with the most common (default) chart settings. Settings made on this screen can be used to create all charts. There is an option on that screen to ignore all the settings. Themes
Chart themes enable you to quickly change many chart properties with a single mouse click. Several themes are provided through the Themes Editor. Multi-Page Charts
If your chart contains more data than can be legibly displayed on one chart screen, you may wish to divide the chart into pages that can be leafed through. All charts can be divided into a set number of points per page. This allows the chart to be viewed with multiple pages. If the number of points per page is set to 0 on the default settings screen, all data points will be charted on a single page chart. Chart Options
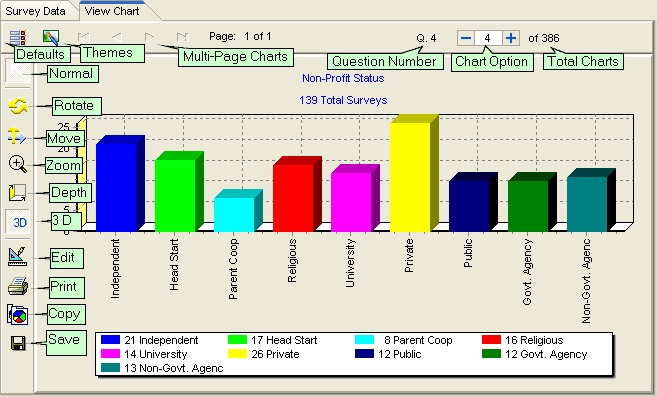
This spinner allows you to select a chart by pressing the (-) or (+) button without returning to the option box on the Select Data tab. The total number of chart options is also displayed. Normal
This button deactivates the Rotate, Move, Zoom, and Depth buttons. Rotate
Select this button, then select an area of the chart to be rotated with the left mouse button. Drag the mouse cursor to rotate the chart to the desired location. Move
Select this button, then select an area of the chart to be moved with the left mouse button. Drag the mouse cursor to move the chart to the desired location. Zoom
Select this button, then select an area of the chart to be zoomed with the left mouse button. Drag the mouse cursor to enlarge and reduce the chart size. Depth
Select this button, then select an area of the chart for the depth to be increased or decreased with the left mouse button. Drag the mouse cursor to change the chart. 3 Dimensions
Toggling this button will change the chart from a 3D to a 2D chart. Edit
The Chart Editor is displayed when this button is clicked. The editor is designed to help you modify all parts of the chart. Each section has additional selections that can be used to drill-down to particular chart settings. There are hundreds of chart settings that can be modified. Don't be overwhelmed by the huge number of settings. Approach the modifications based on your answers to branching decisions. Print
When clicked, a print preview screen is displayed. You can change various settings prior to printing.
 Copy
CopyClicking this button copies the chart to the Windows clipboard. Save
The settings for the displayed chart are saved with this selection. Chart Title
The chart titles use the question topics entered when the questions were created. If the checkbox on the default screen setting is marked for Include Survey Count as Chart Subtitle, then the second line of the chart label will display the survey count. These charts are only available in the professional version of WISCO Survey Power.